HomeMonitoring Server Resource Utilization Statistics
View Categories
Monitoring Server Resource Utilization Statistics
< 1 min read
Server statistics can be monitored directly through the platform.
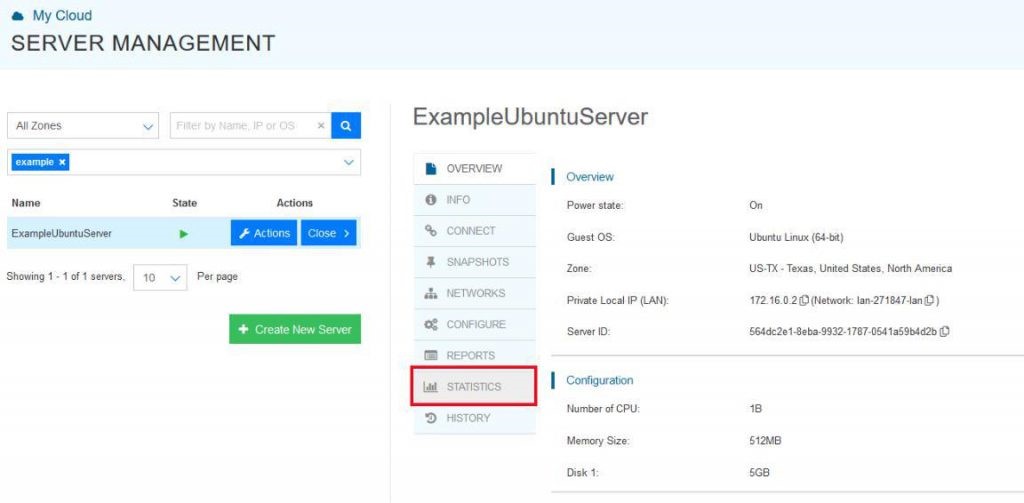
Go to the “Servers” tab of the platform, which can be found under “My Cloud” in the left panel.
Select “Open” under the server you’d like to view the statistics of, and then select “Statistics”.
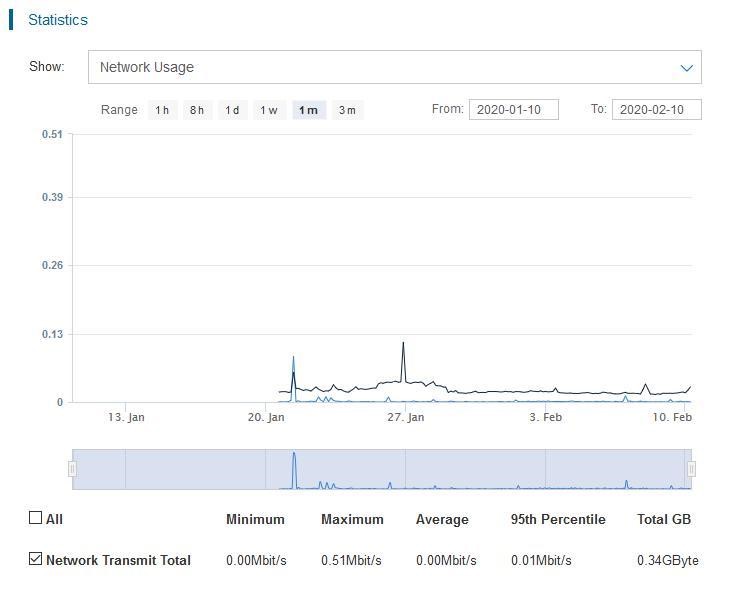
3. Here you can view the detailed resource utilization statistics of the VM including CPU usage, RAM usage, advanced WAN and LAN transfer information, and disk